Product update
ReWind Update: Circularity Data Per Provider & More
ReWind Update: Circularity Data Per Provider & More

These releases are about making decisions easier: comparing scenarios, finding parameters in configuration settings, discovering providers, and seeing which providers support your circularity goals.
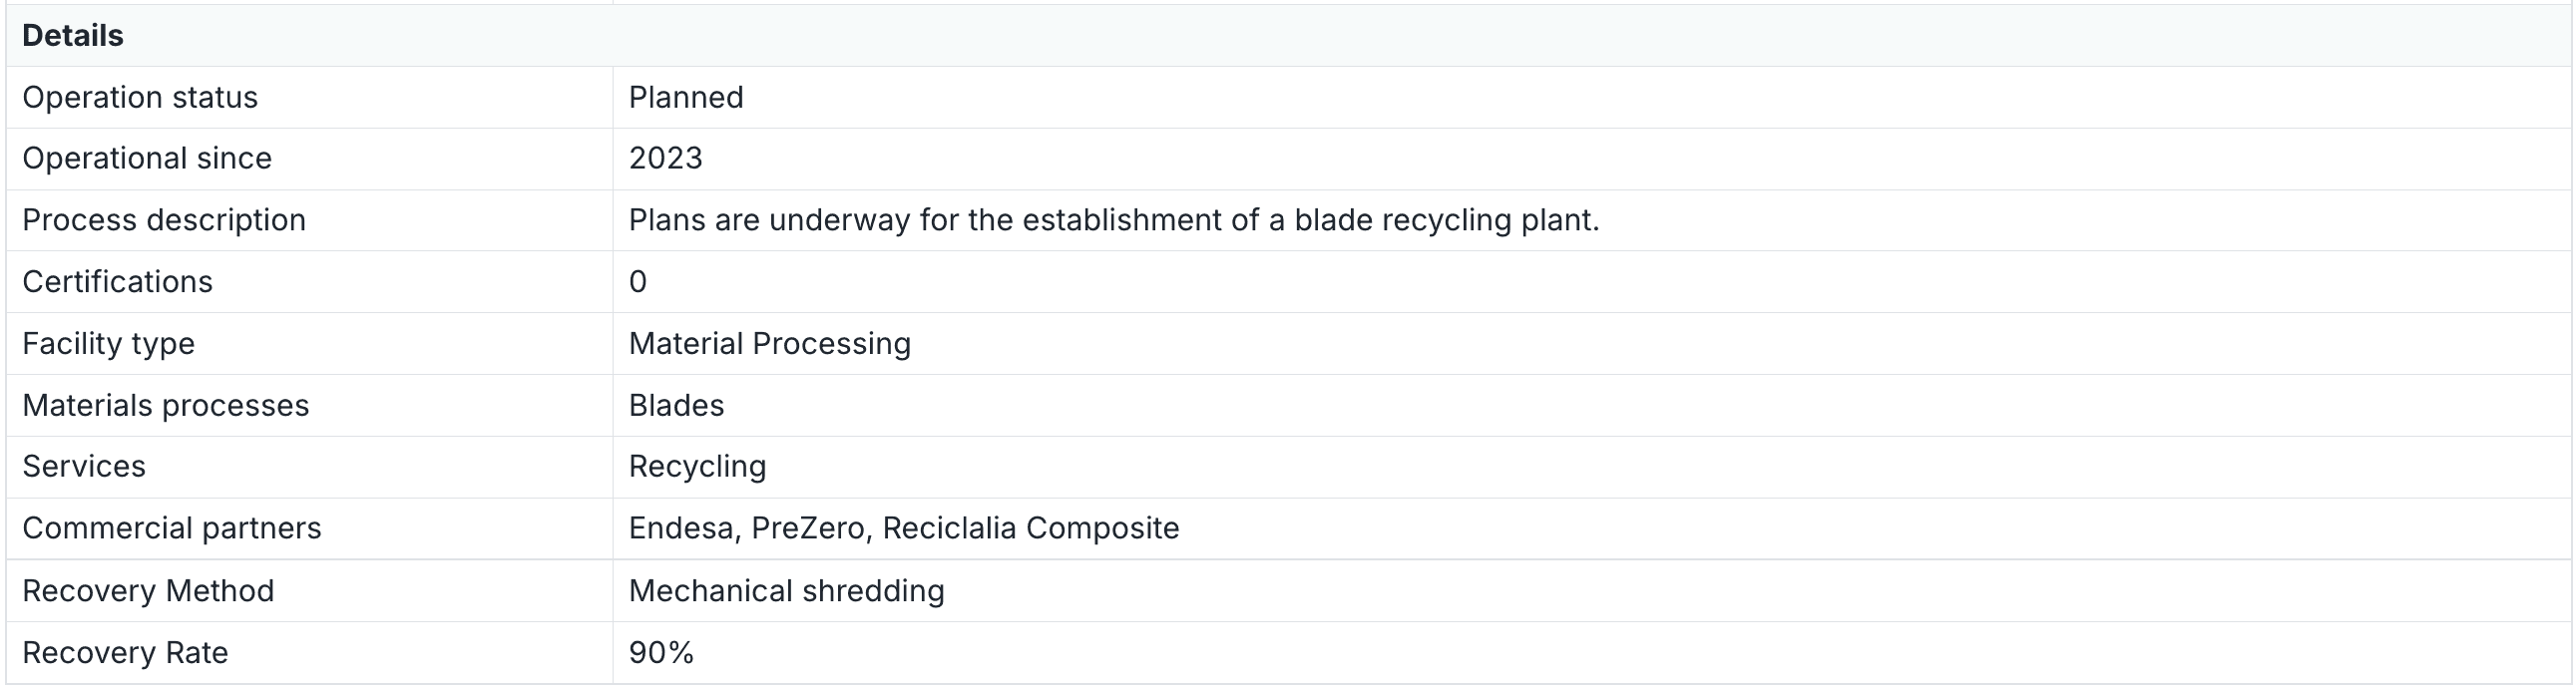
Circularity Data Per Provider
See exactly how each provider contributes to the circular recovery of your wind farm components, down to the blade recovery method and recovery rate. You might find that one provider recovers 90-100% of blade material via mechanical shredding, while another recovers 60% via energy recovery. That difference now shows up directly in your decommissioning plan, and on the providers map.
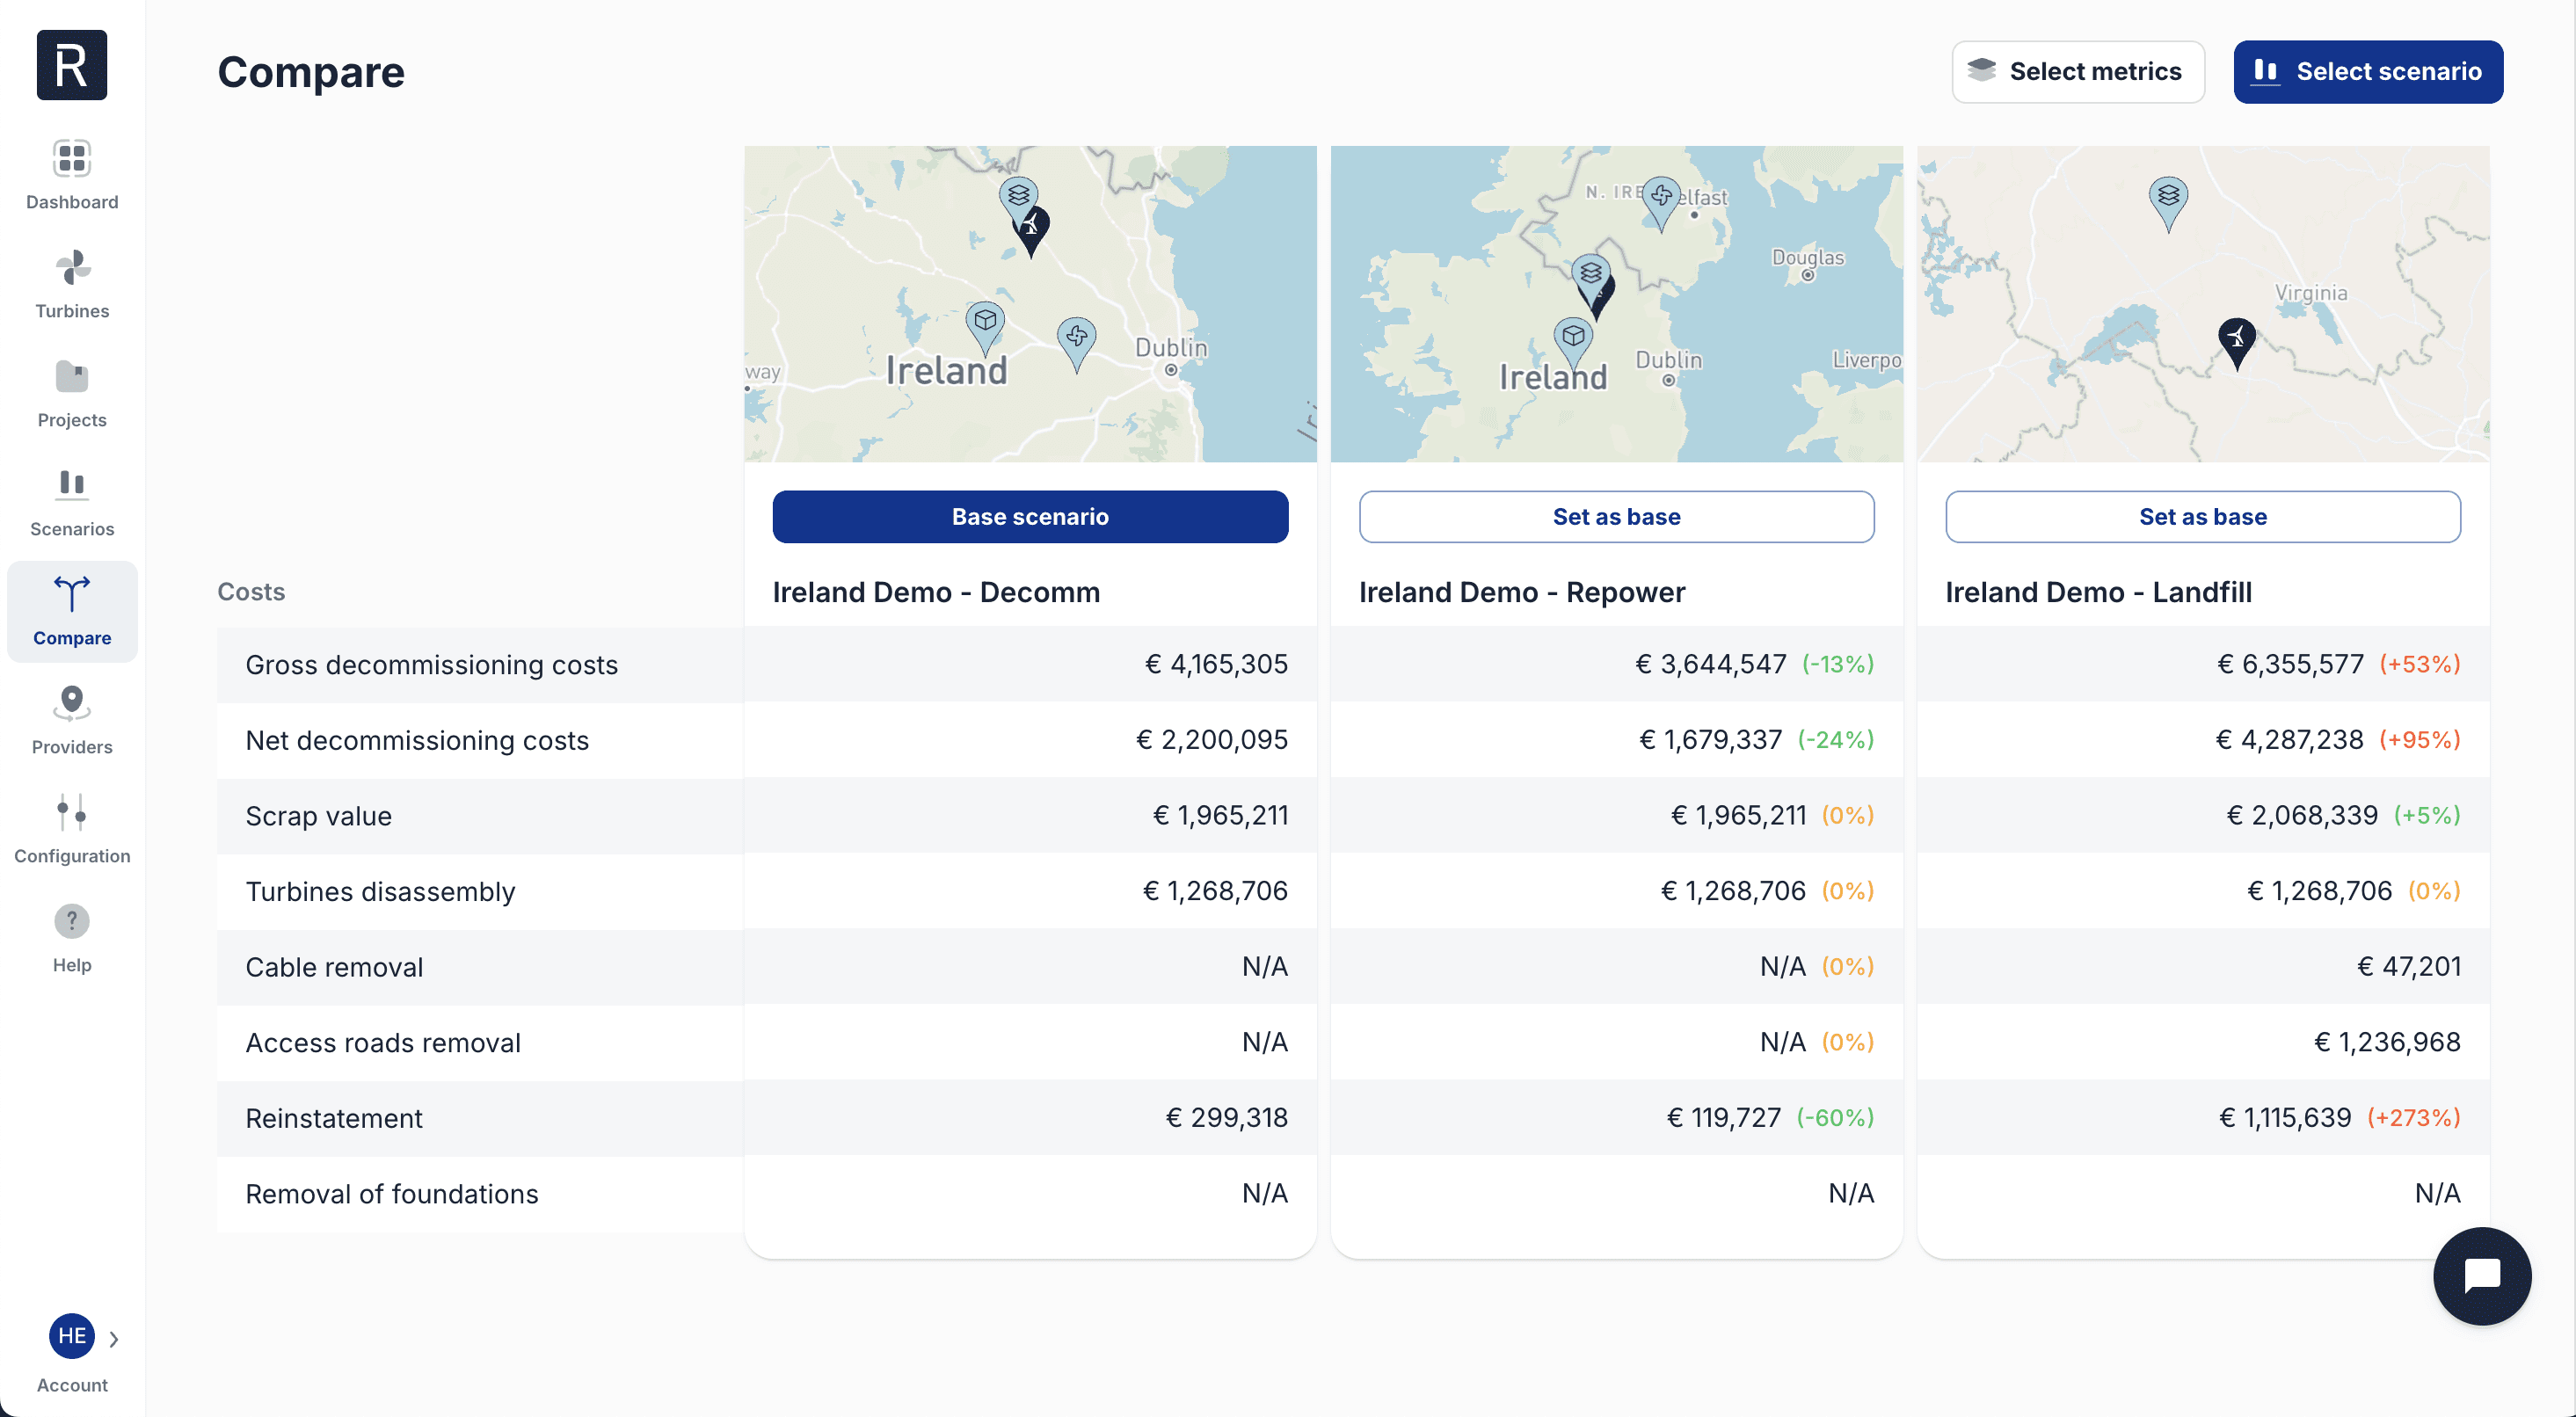
Compare: Set as Base Case
Pick any scenario as your base case, and every other scenario shows as a delta against it. Want to see how repowering scenario stacks up against your current decommissioning plan? One click, and the numbers tell you directly: +53% gross cost, -24% net cost, and so on. Much simpler for evaluating trade-offs.
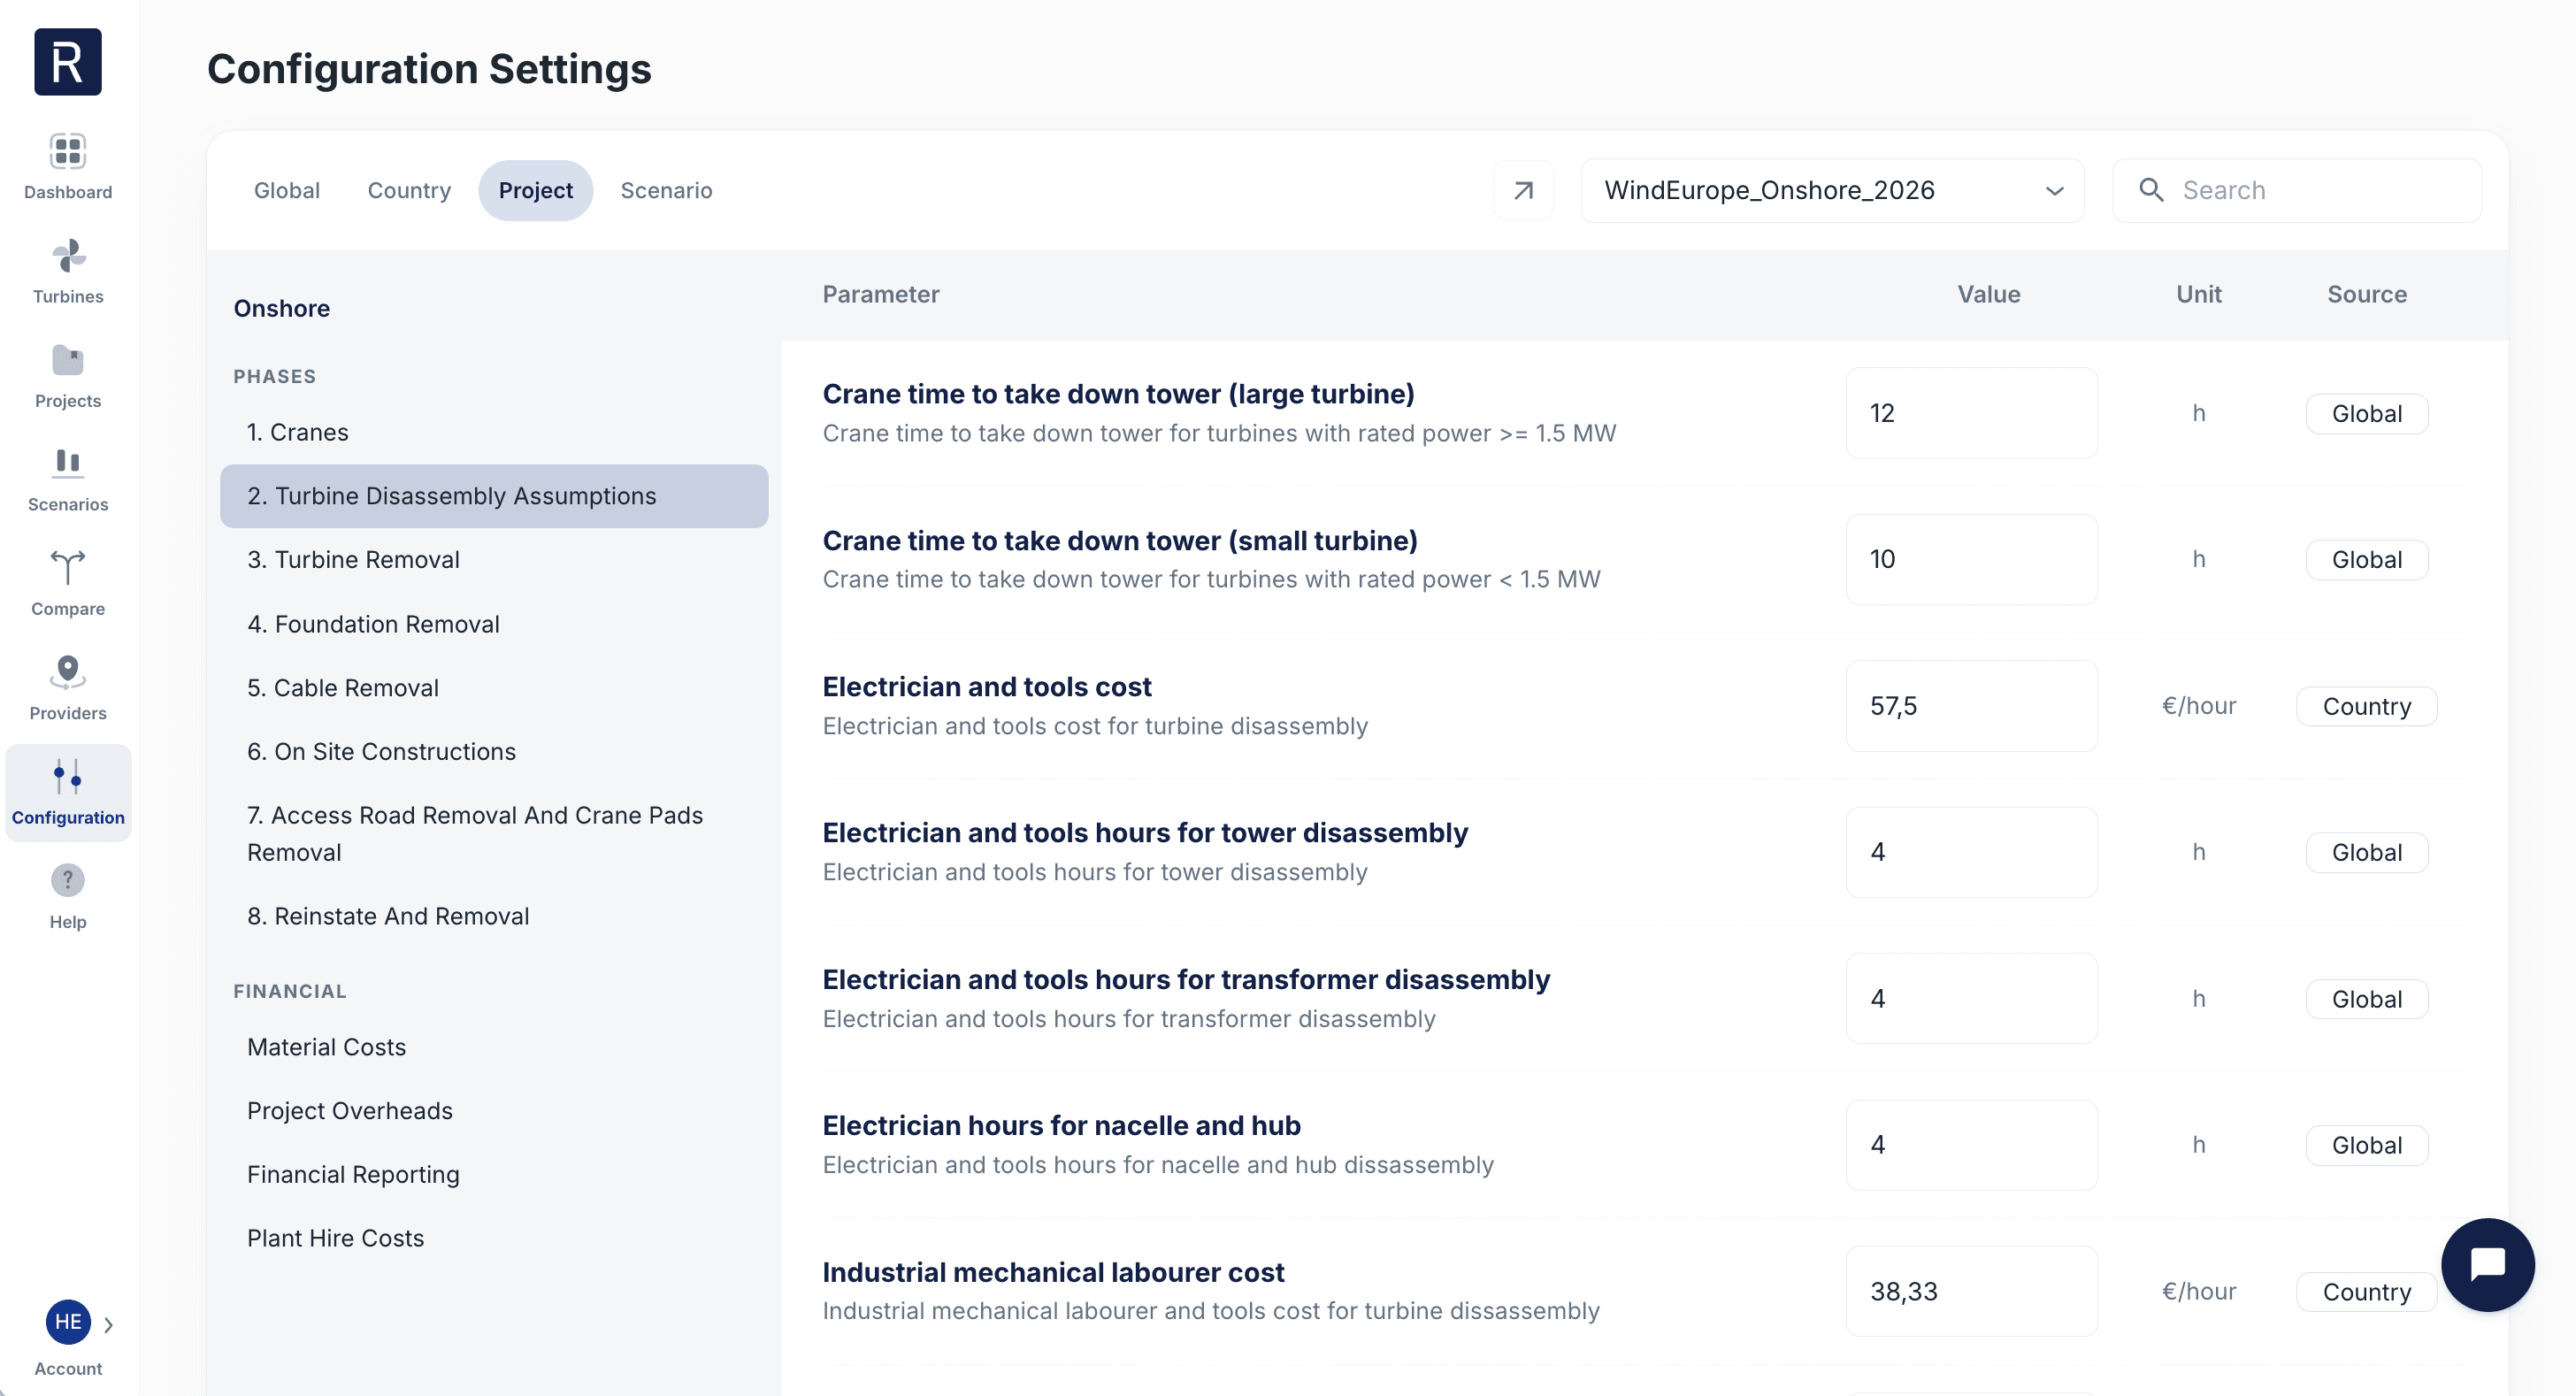
Configuration Settings
Search for cost assumptions. Quickly lets you find cost parameters.
Onshore and offshore cost categories grouped by decom phase. Makes it easier to find which settings affect the different parts of the decom process.
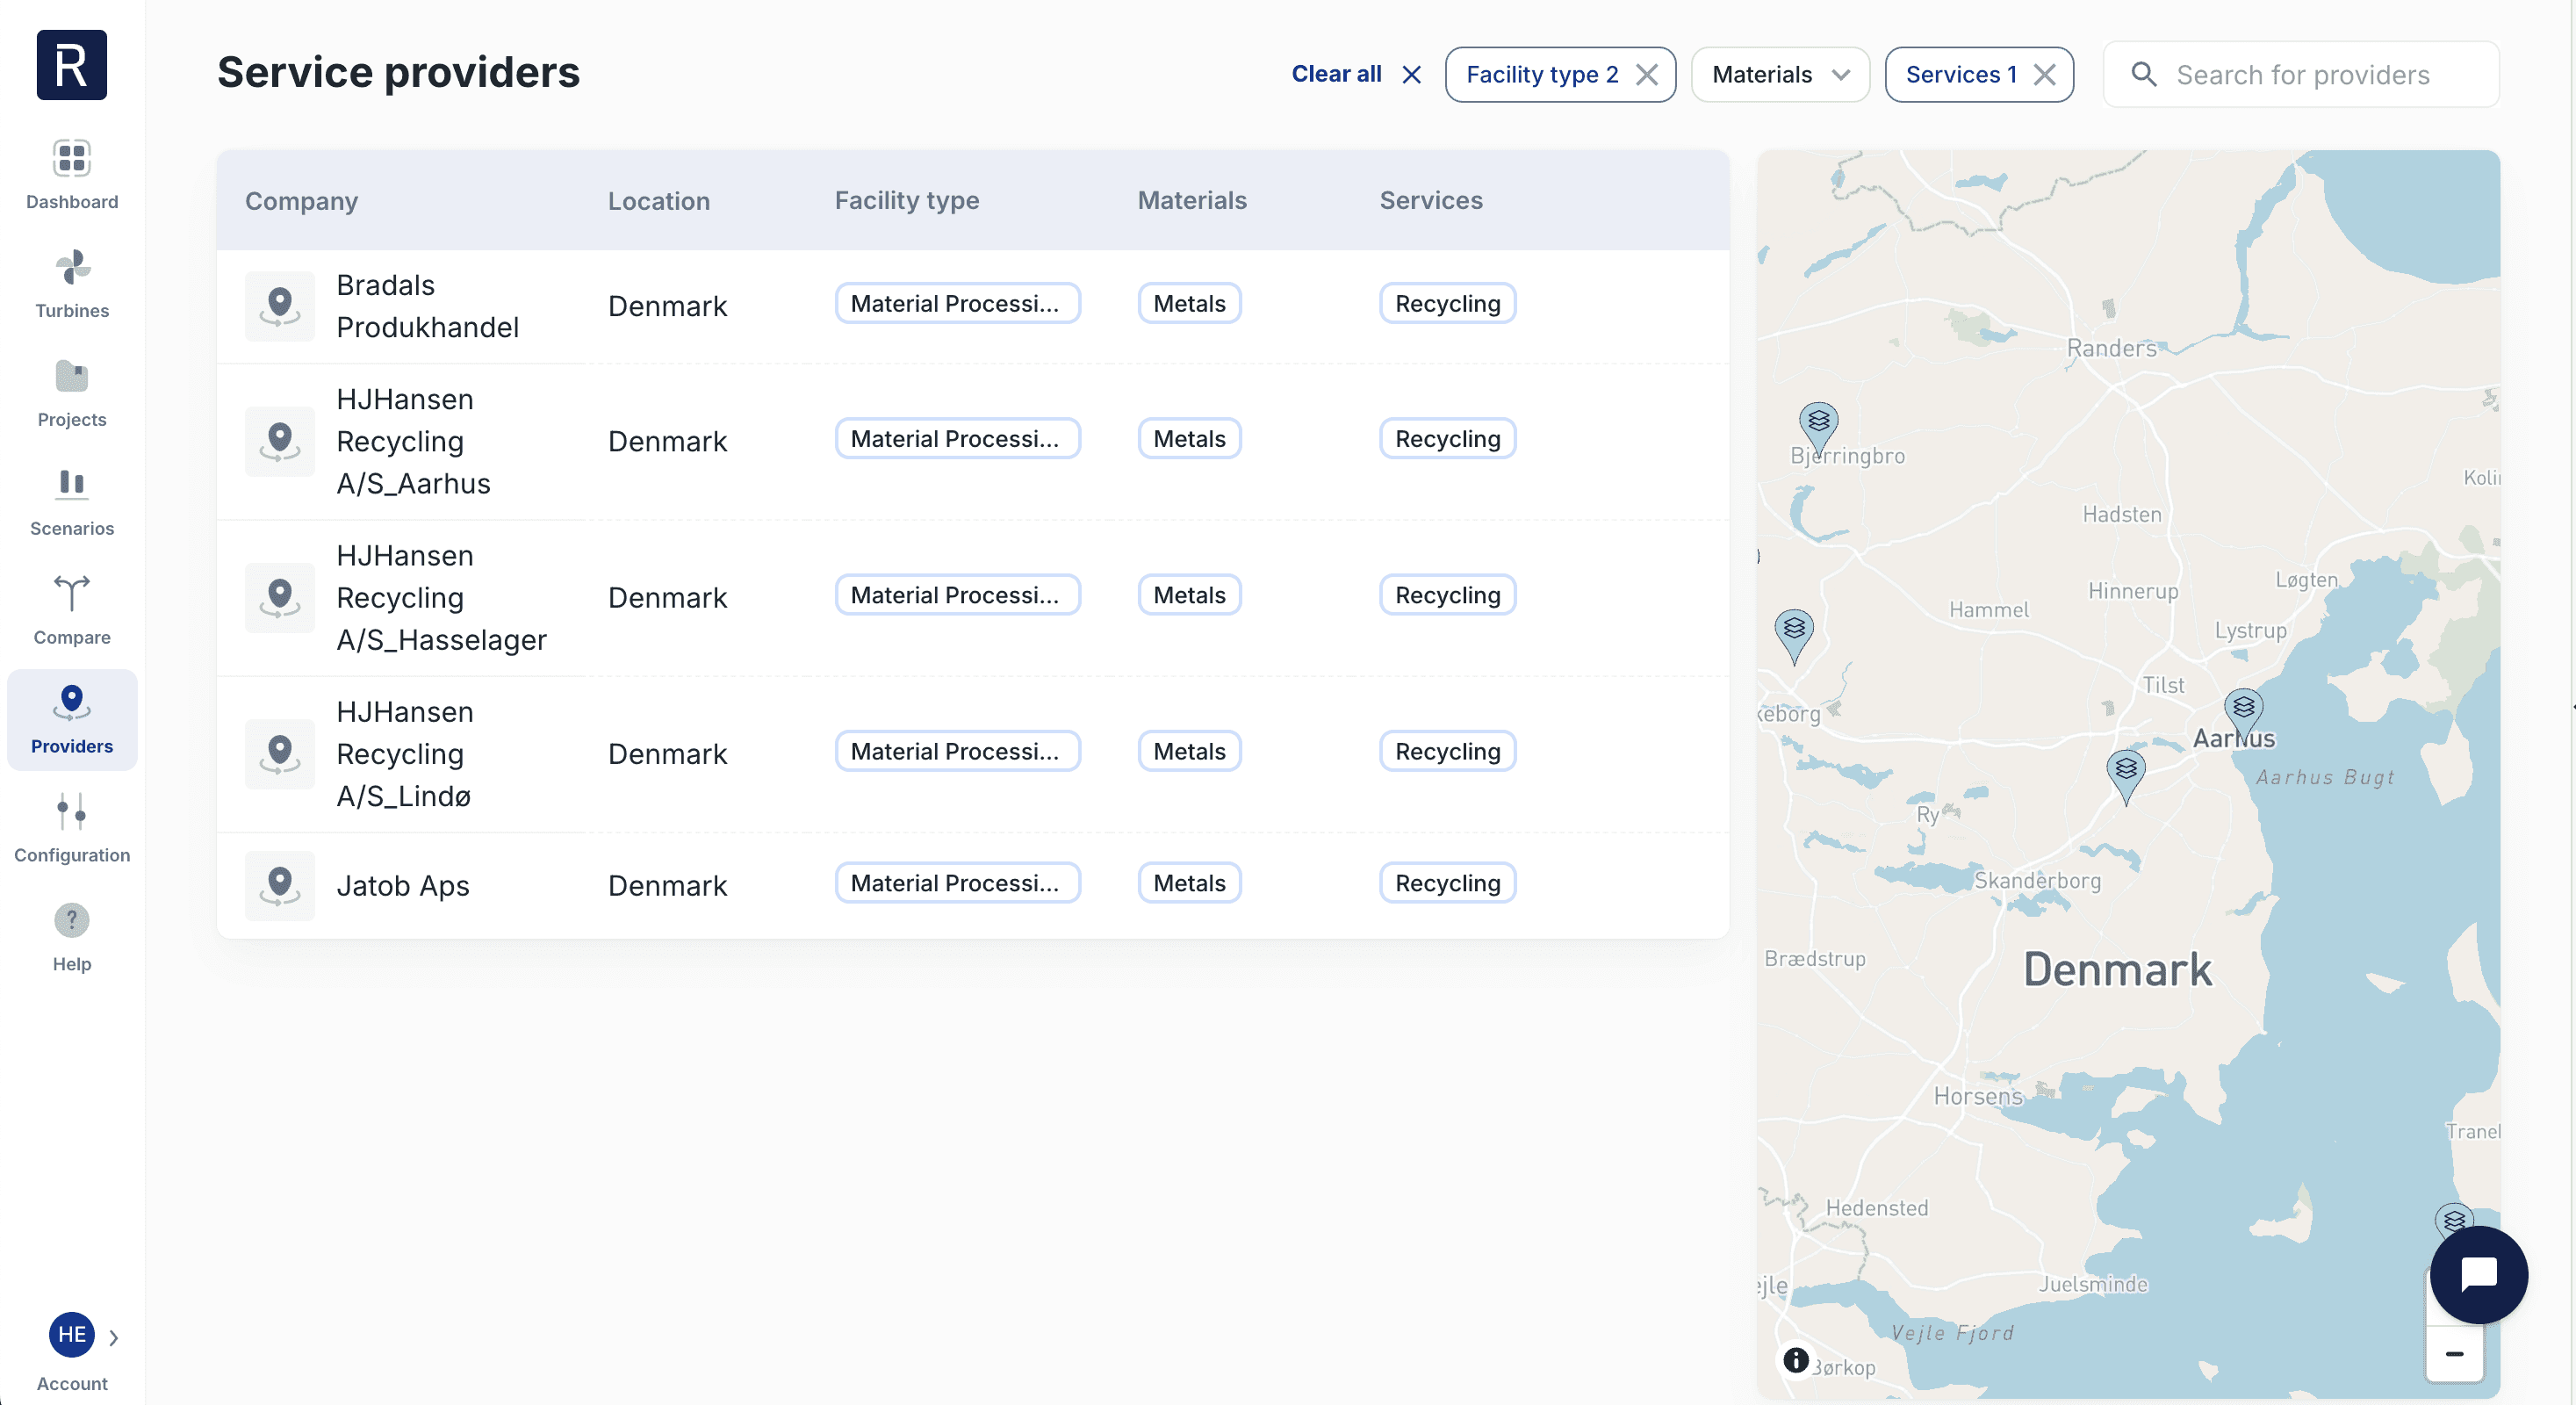
Service Providers
3x faster map loading. From 3+ seconds, now under 1
Map-driven filtering. New layout puts facility type, materials, and services front-and-center, so you can scan a list of providers without clicking into each one. Zoom or pan the map, and the list shows only the providers in the area.
These releases are about making decisions easier: comparing scenarios, finding parameters in configuration settings, discovering providers, and seeing which providers support your circularity goals.
Circularity Data Per Provider
See exactly how each provider contributes to the circular recovery of your wind farm components, down to the blade recovery method and recovery rate. You might find that one provider recovers 90-100% of blade material via mechanical shredding, while another recovers 60% via energy recovery. That difference now shows up directly in your decommissioning plan, and on the providers map.
Compare: Set as Base Case
Pick any scenario as your base case, and every other scenario shows as a delta against it. Want to see how repowering scenario stacks up against your current decommissioning plan? One click, and the numbers tell you directly: +53% gross cost, -24% net cost, and so on. Much simpler for evaluating trade-offs.
Configuration Settings
Search for cost assumptions. Quickly lets you find cost parameters.
Onshore and offshore cost categories grouped by decom phase. Makes it easier to find which settings affect the different parts of the decom process.
Service Providers
3x faster map loading. From 3+ seconds, now under 1
Map-driven filtering. New layout puts facility type, materials, and services front-and-center, so you can scan a list of providers without clicking into each one. Zoom or pan the map, and the list shows only the providers in the area.

ReWind AS © 2026. All rights reserved.
Torggata 11, 0181 Oslo, Norway
ReWind AS © 2026. All rights reserved.
Torggata 11, 0181 Oslo, Norway