
Prove the circularity of your decommissioning strategy
Map material flows, quantify recycling rates, and identify critical raw materials across your wind portfolio — with data that satisfies regulators and stakeholders.
Prove the circularity of your decommissioning strategy
Map material flows, quantify recycling rates, and identify critical raw materials across your wind portfolio — with data that satisfies regulators and stakeholders.
Prove the circularity of your decommissioning strategy
Map material flows, quantify recycling rates, and identify critical raw materials across your wind portfolio — with data that satisfies regulators and stakeholders.
95%
demonstrable circularity rate
400+
turbine models analyzed
CSRD
show material inflows and outflows
95%
demonstrable circularity rate
400+
turbine models analyzed
CSRD
show material inflows and outflows
95%
demonstrable circularity rate
400+
turbine models analyzed
CSRD
show material inflows and outflows

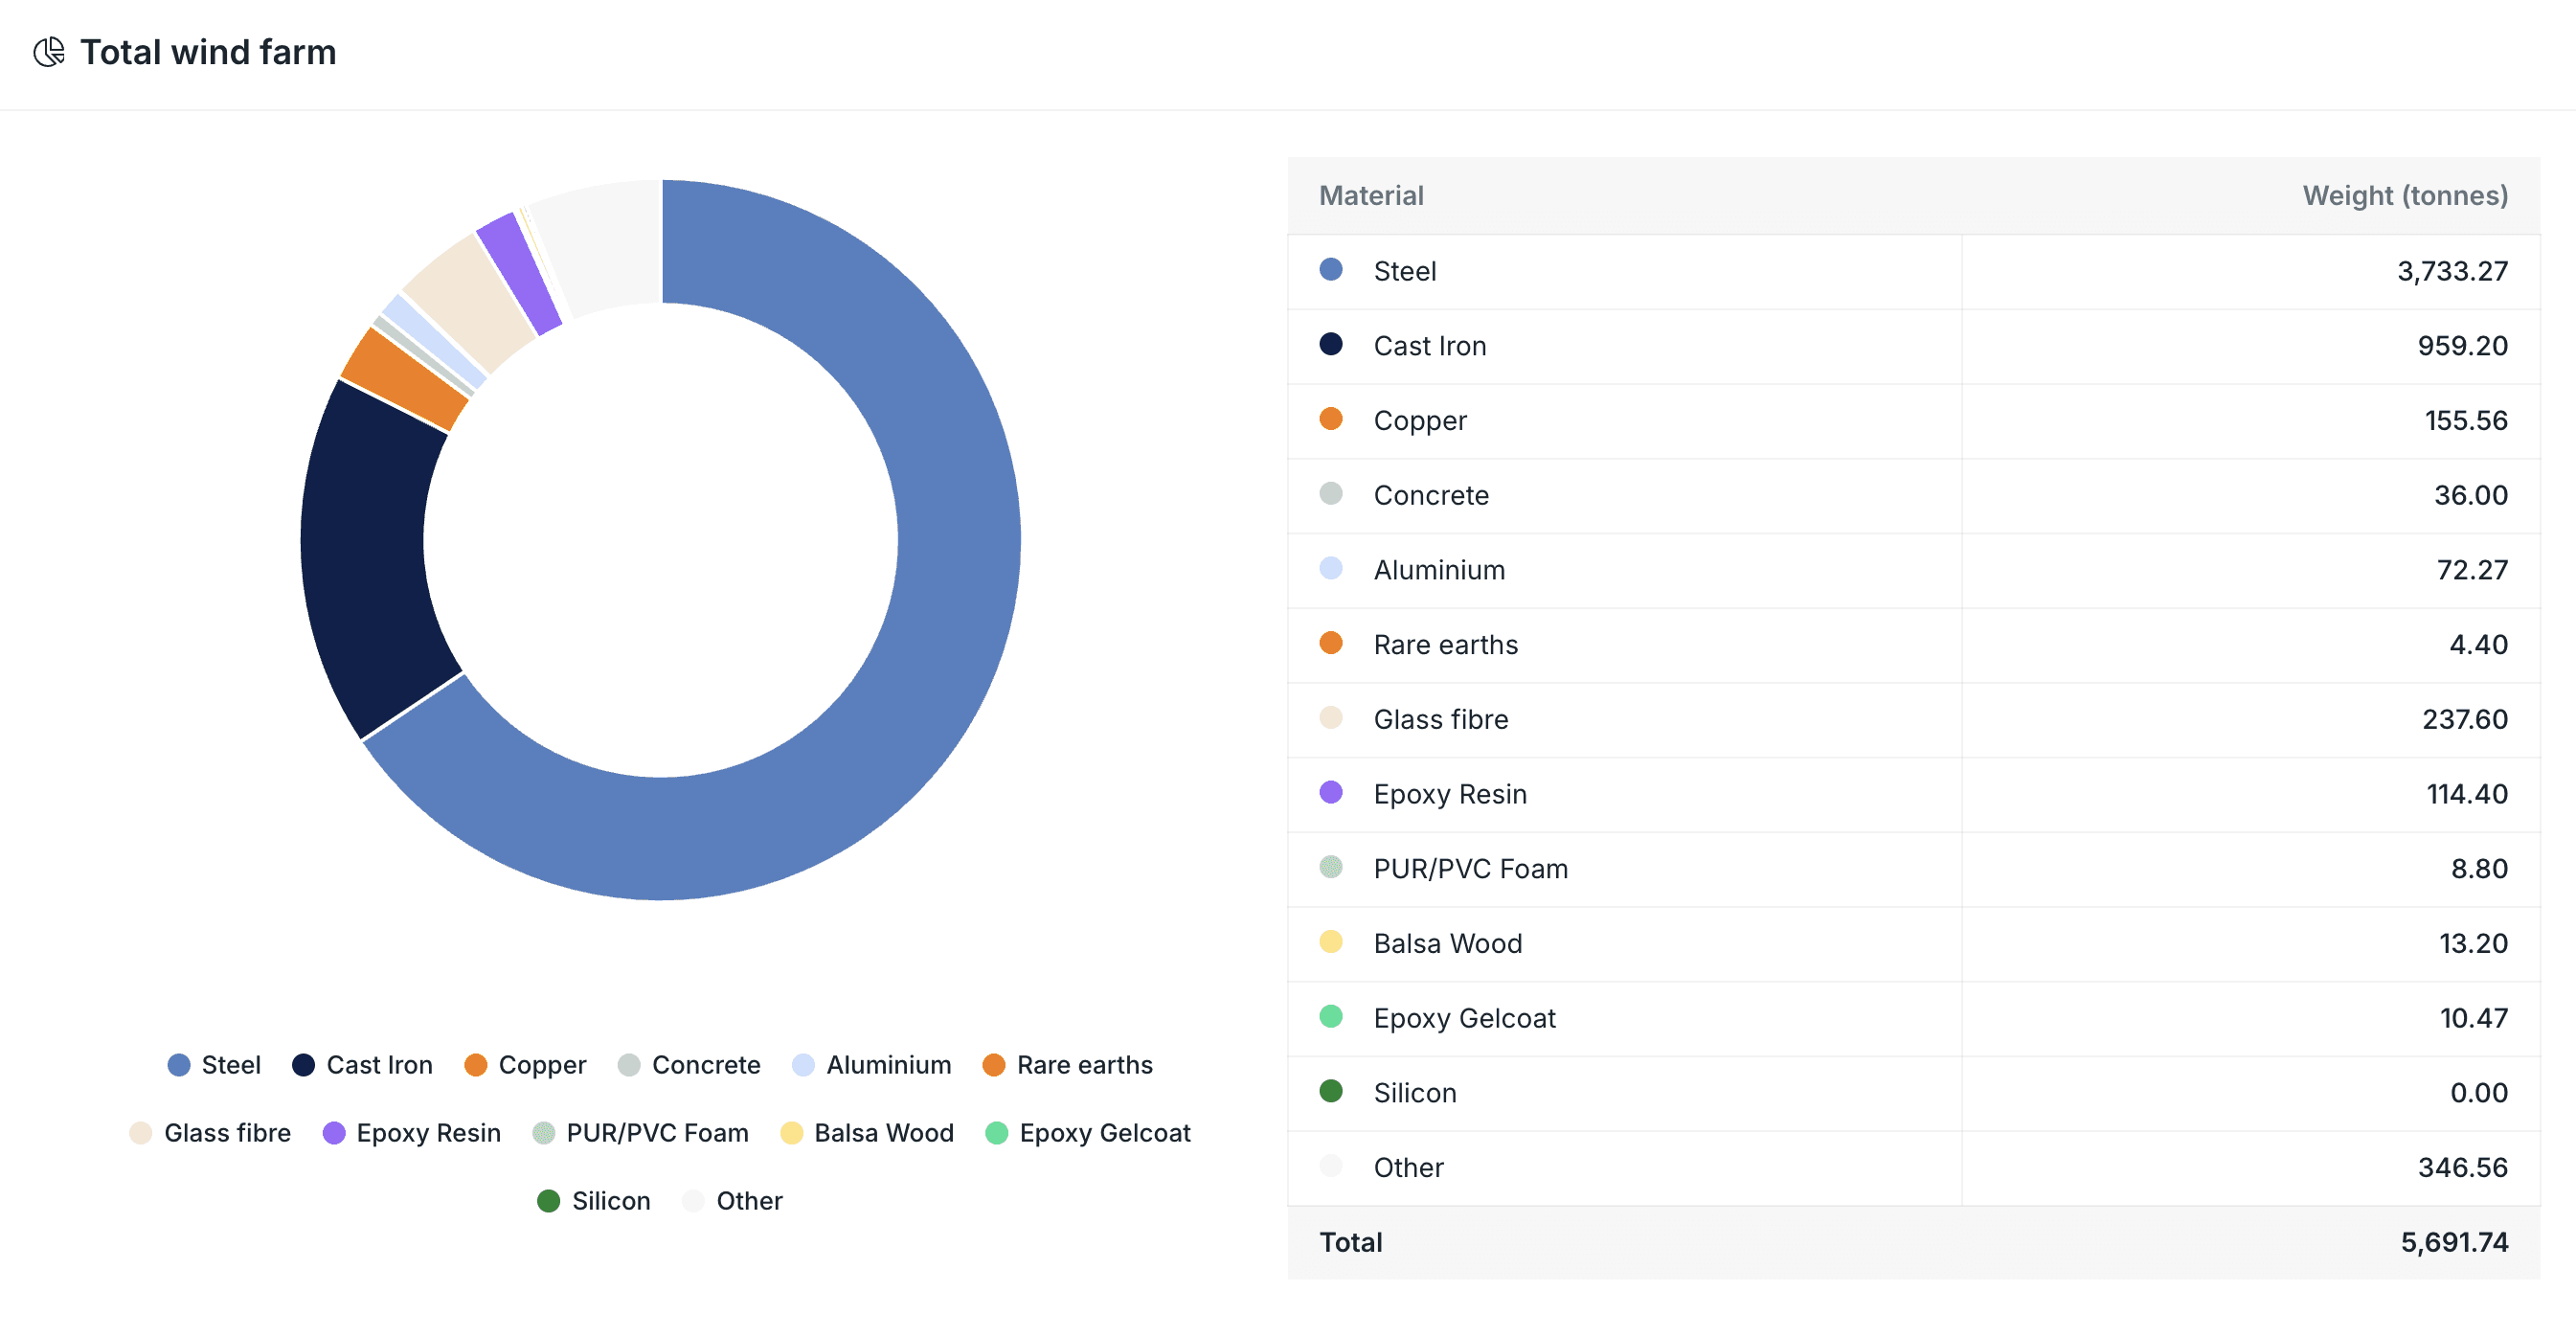
Material breakdown
Understand what your wind farms are made of
Get a complete material breakdown across your portfolio — metals, composites, and rare earth elements. Know exactly what can be recovered, reused, or recycled before decommissioning begins.
Metals and composites analysis across your full portfolio
Identify reuse potential for scarce and high-value resources
Turbine-level granularity — not just site-level averages
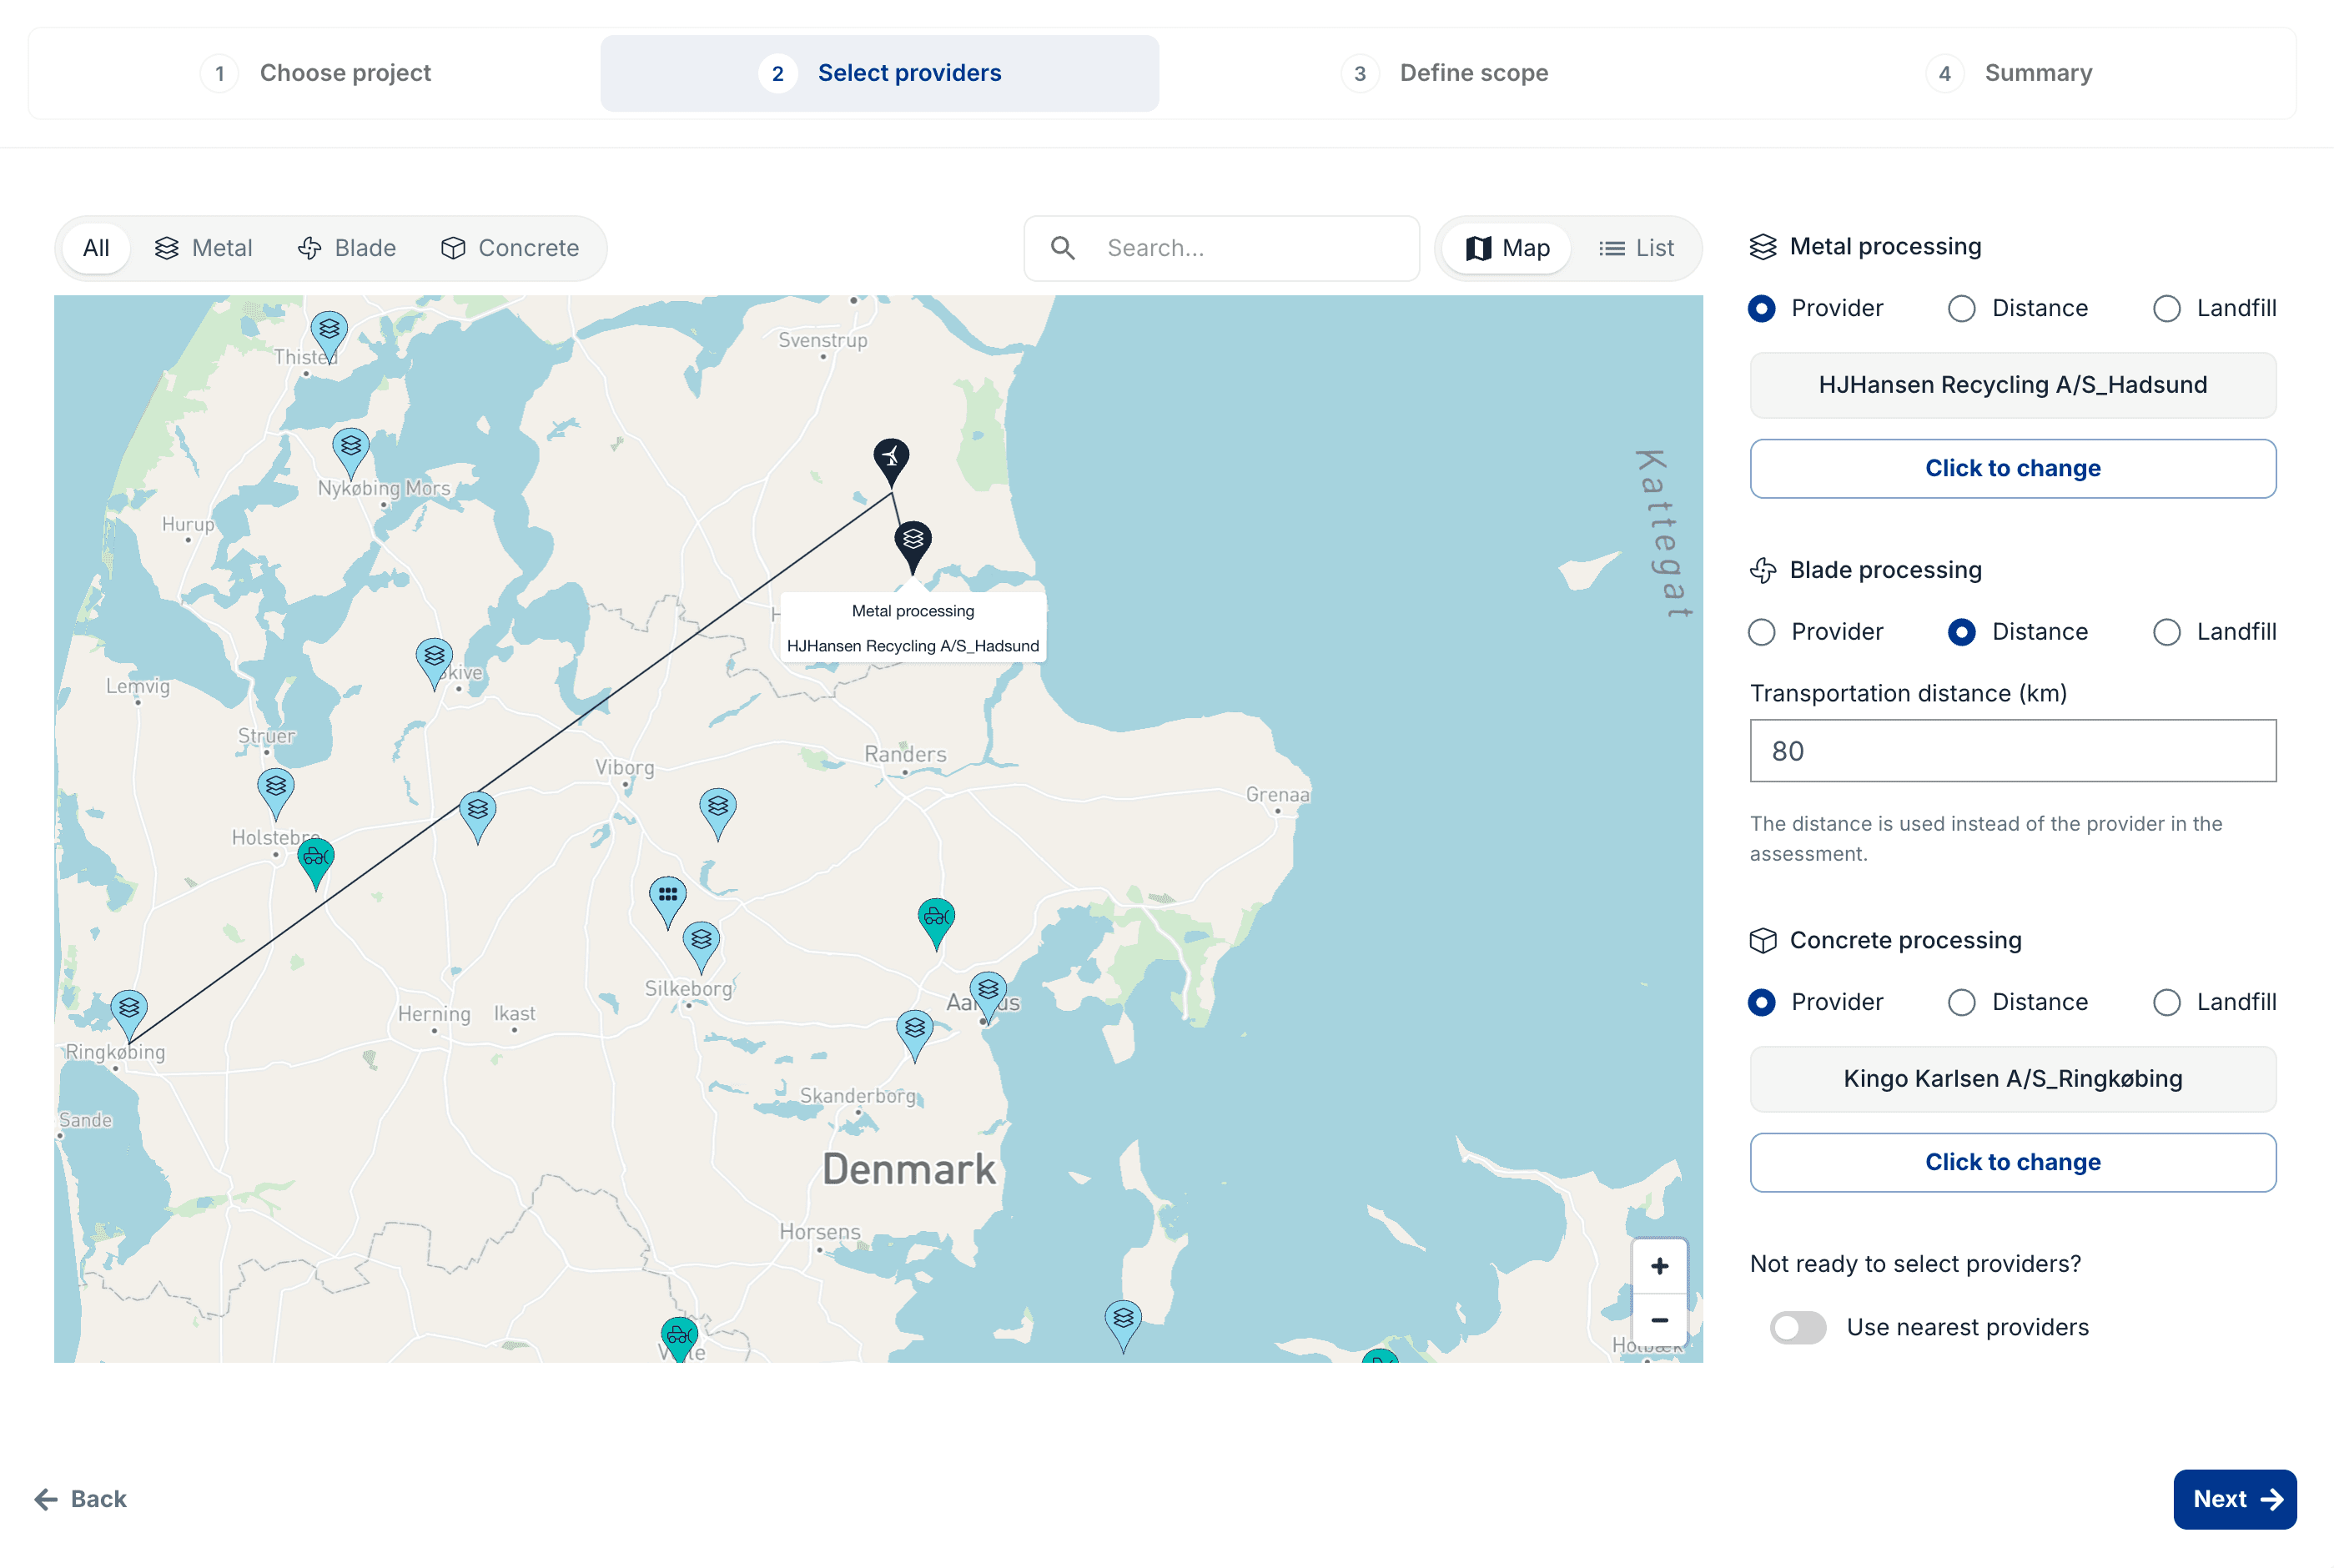
Circularity tracking
Track circularity by method, provider, and component
Understand how different decommissioning methods affect your circularity rates. Compare landfill, reuse, and recycling routes — and see which service providers deliver the highest recovery.
Circularity rates broken down by disposal method
Provider-level comparison — who delivers highest material recovery
Component-level tracking from nacelle to blade tip
"ReWind helped us gain a better understanding of the recyclability of the equipment, the existing and developing recycling methods, including for composite blade waste, forecasted decommissioning costs, and provided recommendations for various stages of the project life cycle that we at Capital Dynamics hope to implement to minimize environmental impact and reduce lifetime emissions."

Gintare Briola
Head of Portfolio Management
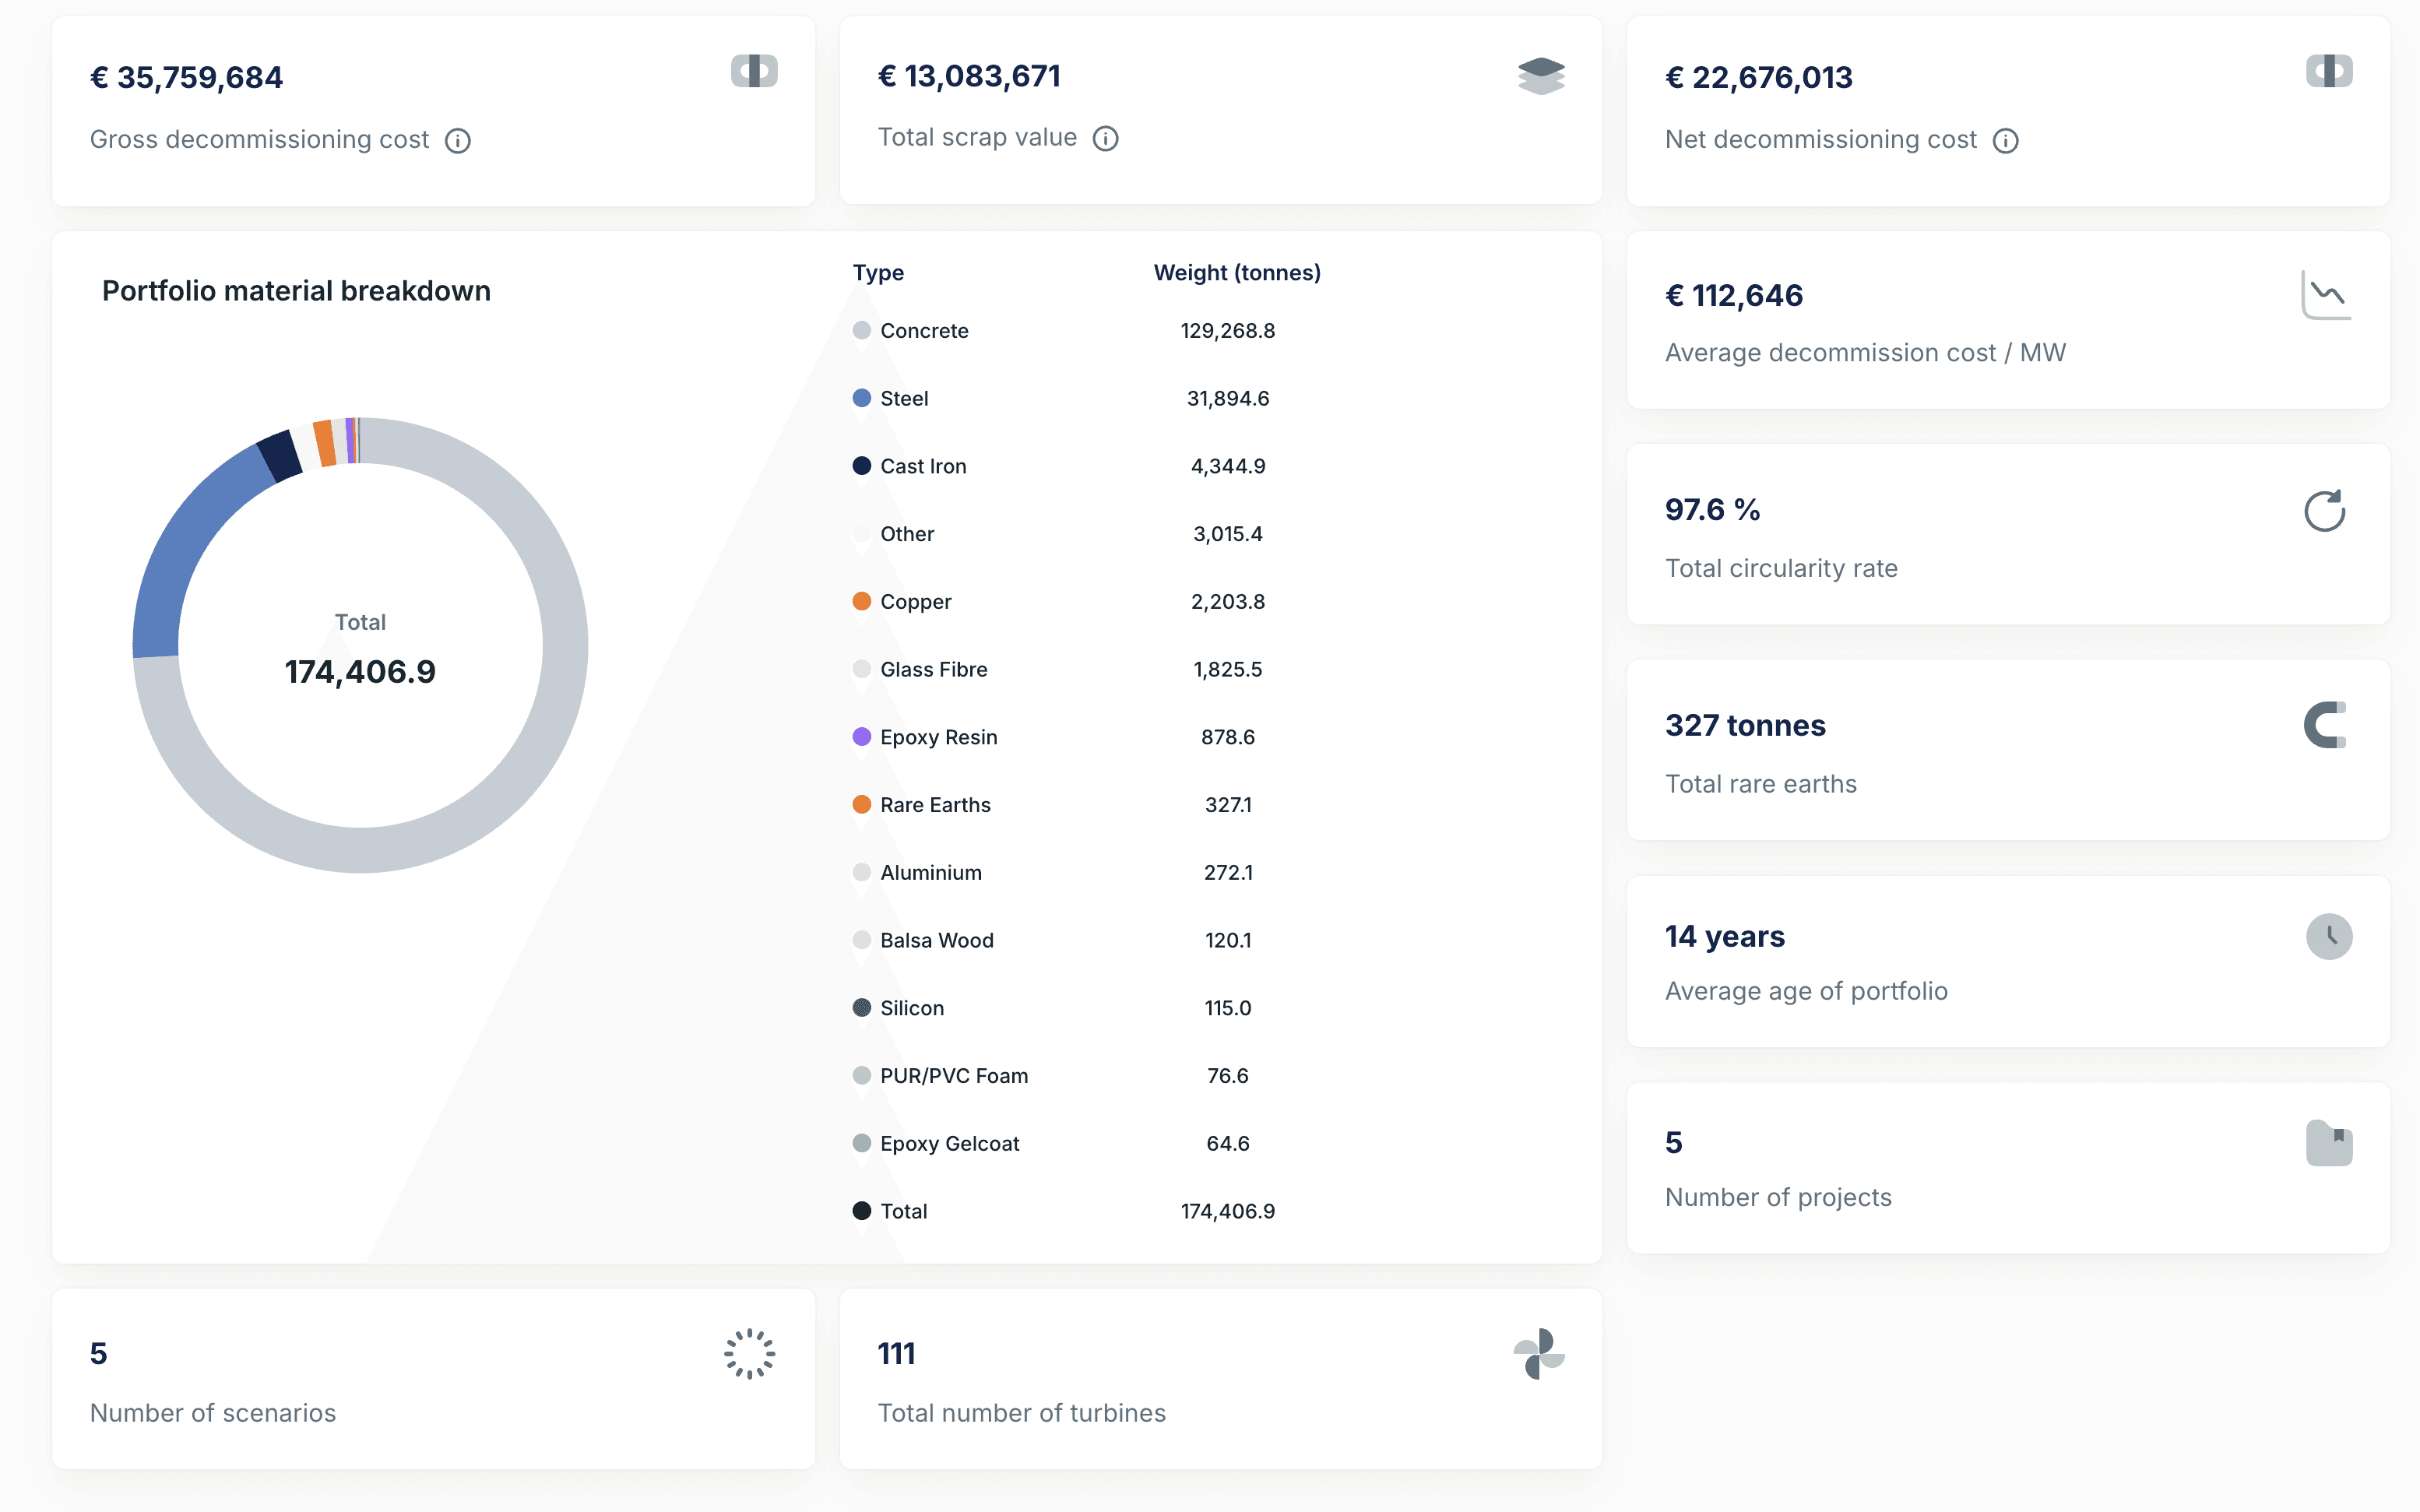
PORTFOLIO ANALYSIS
Map liabilities across your fleet
Get a detailed analysis of materials and decommissioning liabilities across your fleet. Reuse scarce resources and calculate the marginal cost of impact.
Portfolio material breakdown
Aggregated decommissioning costs
Total scrap value in fleet
PORTFOLIO ANALYSIS
Map liabilities across your fleet
Get a detailed analysis of materials and decommissioning liabilities across your fleet. Reuse scarce resources and calculate the marginal cost of impact.
Portfolio material breakdown
Aggregated decommissioning costs
Total scrap value in fleet
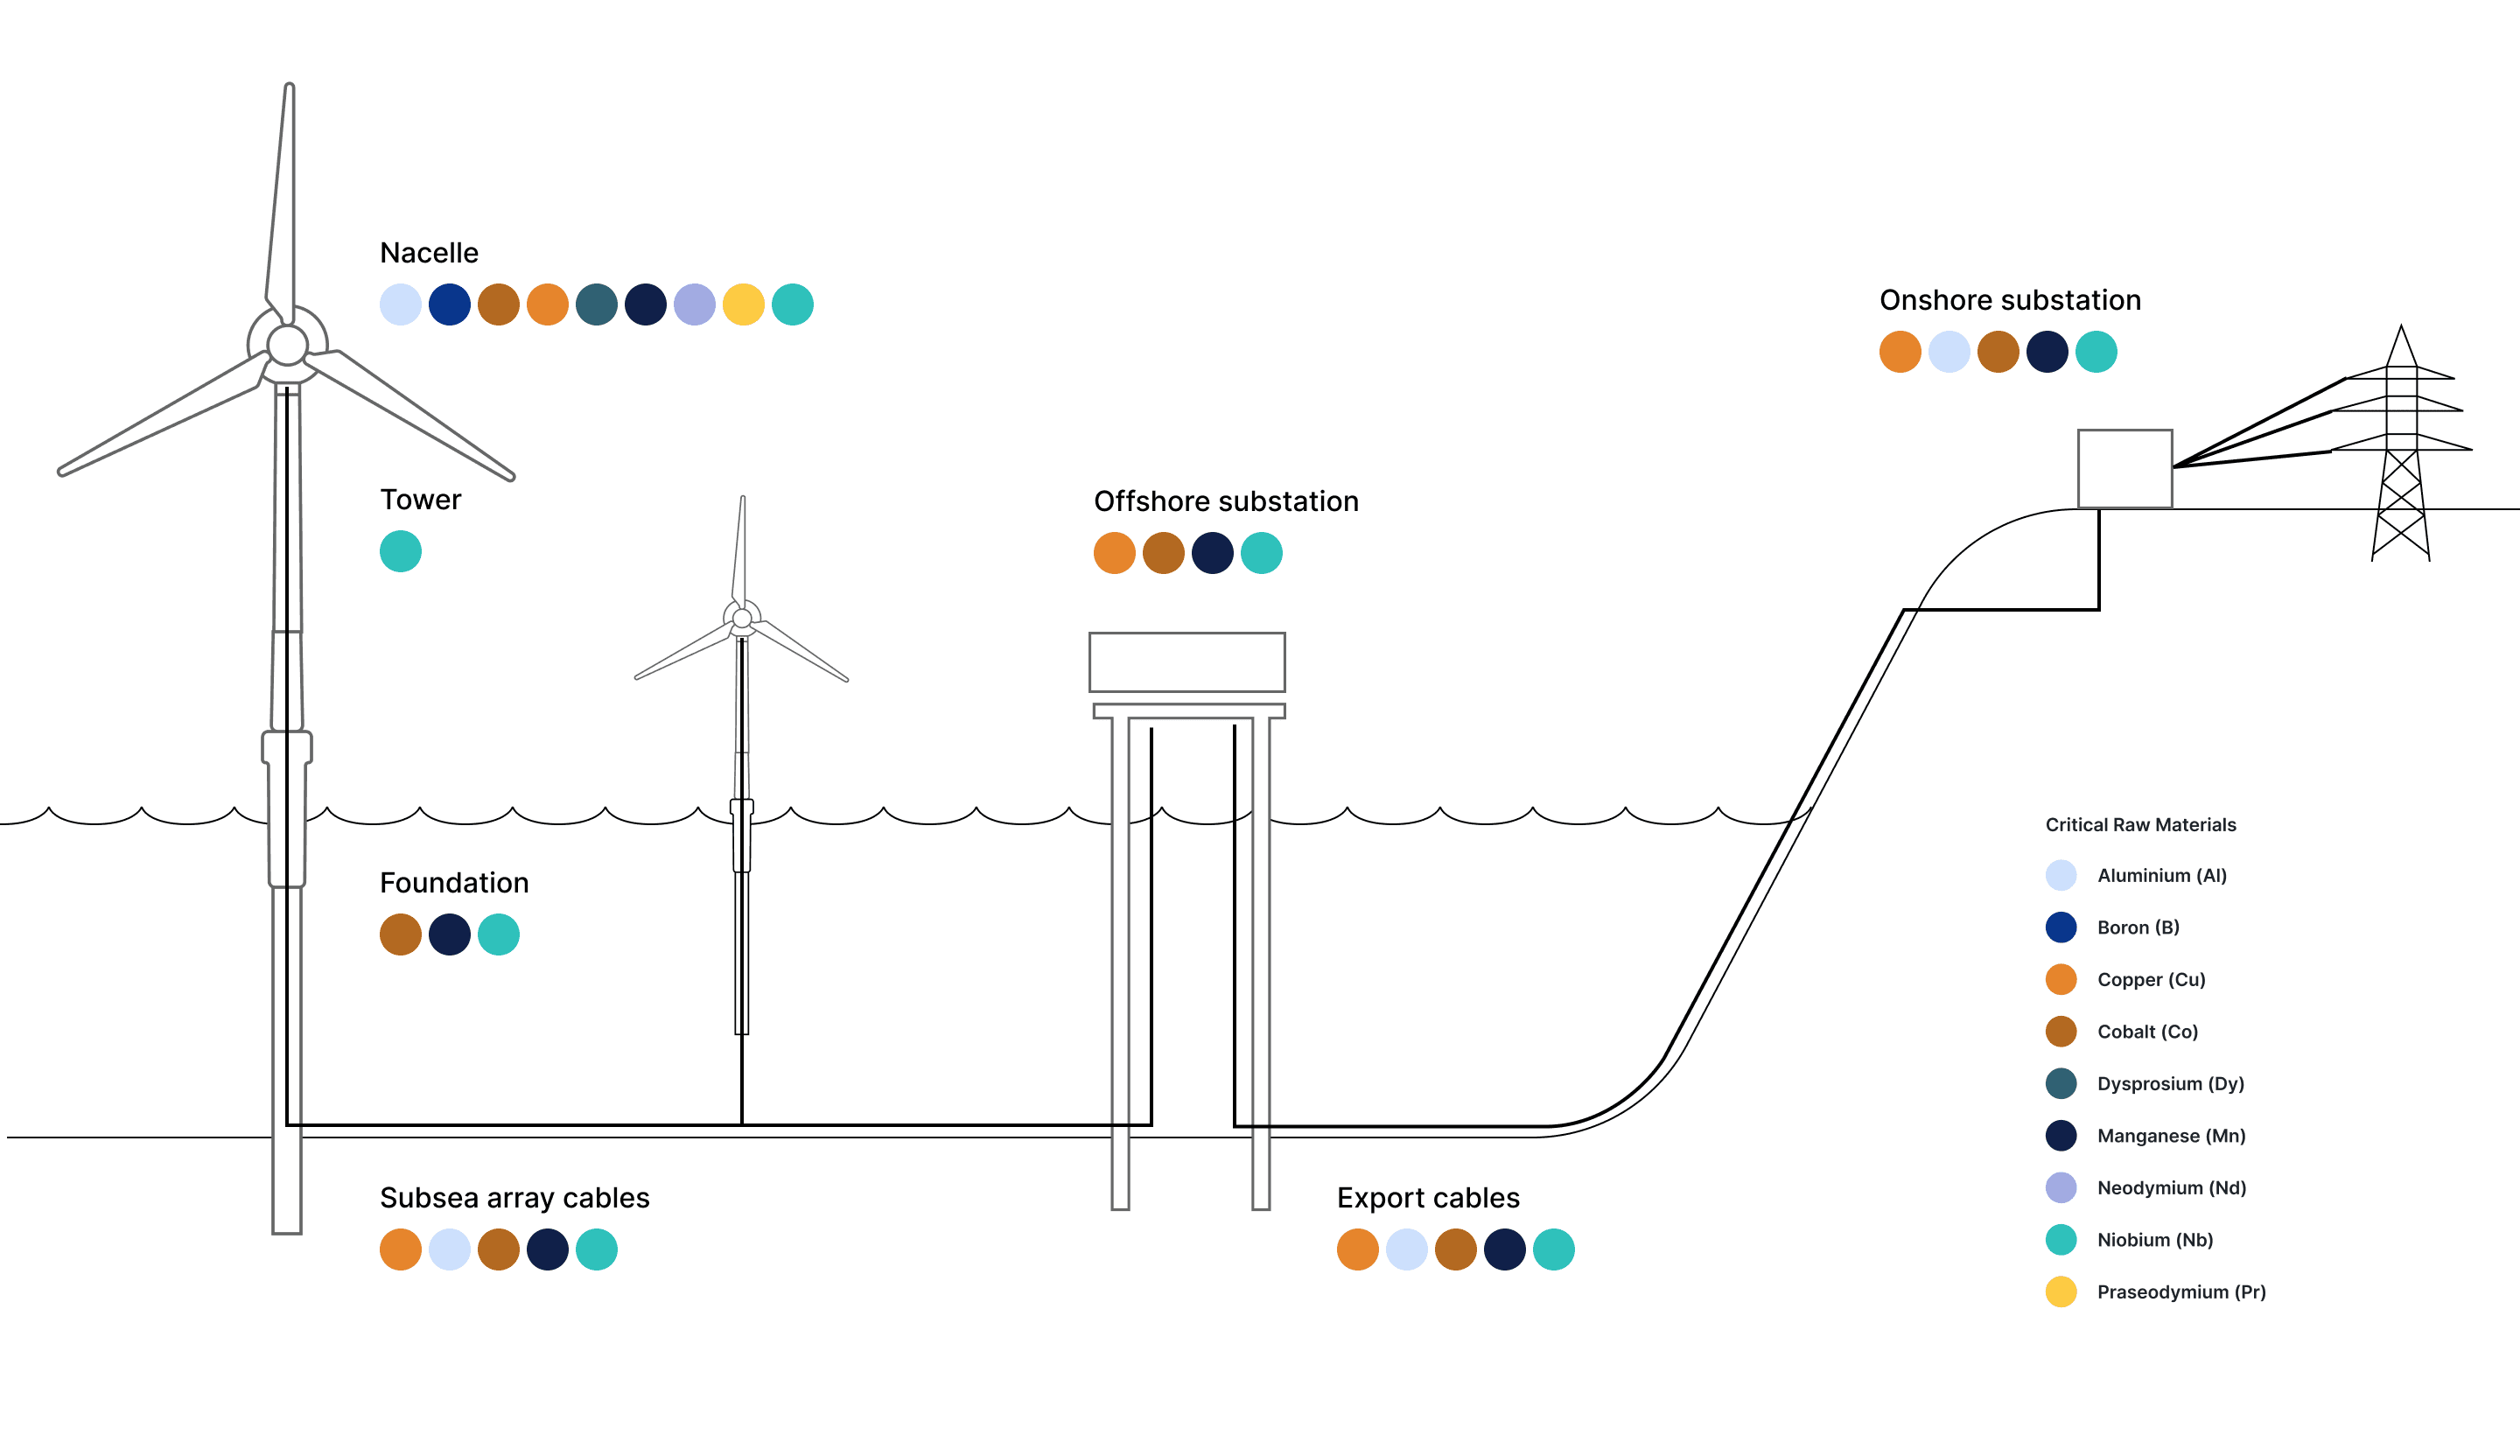
Critical Raw Materials
Uncover the CRMs hidden in your wind farms
Wind turbines contain critical raw materials — rare earths, copper, and speciality metals — that are increasingly regulated and valuable. ReWind maps these across your portfolio so you can plan recovery.
CSRD and ESRS compliance
Quantify recovery potential and economic value
Identify critical raw materials embedded in turbine components

Ready to plan smarter end-of-life?
See how ReWind models materials, circularity and decommissioning for your fleet. Book a 20-minute walkthrough with our team
Free · 20 min walkthrough · No commitment
Ready to plan smarter end-of-life?
See how ReWind models materials, circularity and decommissioning for your fleet. Book a 20-minute walkthrough with our team
Free · 20 min walkthrough · No commitment
Ready to plan smarter end-of-life?
See how ReWind models materials, circularity and decommissioning for your fleet. Book a 20-minute walkthrough with our team
Free · 20 min walkthrough · No commitment

ReWind AS © 2026. All rights reserved.
Torggata 11, 0181 Oslo, Norway
ReWind AS © 2026. All rights reserved.
Torggata 11, 0181 Oslo, Norway
ReWind AS © 2026. All rights reserved.
Torggata 11, 0181 Oslo, Norway